2019 – Understanding the current energy situation in Japan (Part 1)
(in provisional translation)
(English ver.) 2019-11-01

TOPICS
Japan’s energy self-efficiency ratio and dependence on imports
Energy such as electricity, gas and petrol, being indispensable for human life, is supporting our society. Japan, as a country that lacks resources such as oil and LNG (liquefied natural gas), needs various measures to secure a stable supply of energy.
The energy self-efficiency ratio of Japan in 2017 was 9.6%, which is a low level when compared with other OECD countries. It has been increasing since 2014 when it was 6.4%, the lowest ever. However, a low energy self-efficiency ratio results in dependence on other countries for resources. This makes a country susceptible to the effects of international situations, causing difficulties in securing energy in a stable manner.
Comparison of Primary Energy Self-Sufficiency Ratios of Major Countries (2017)
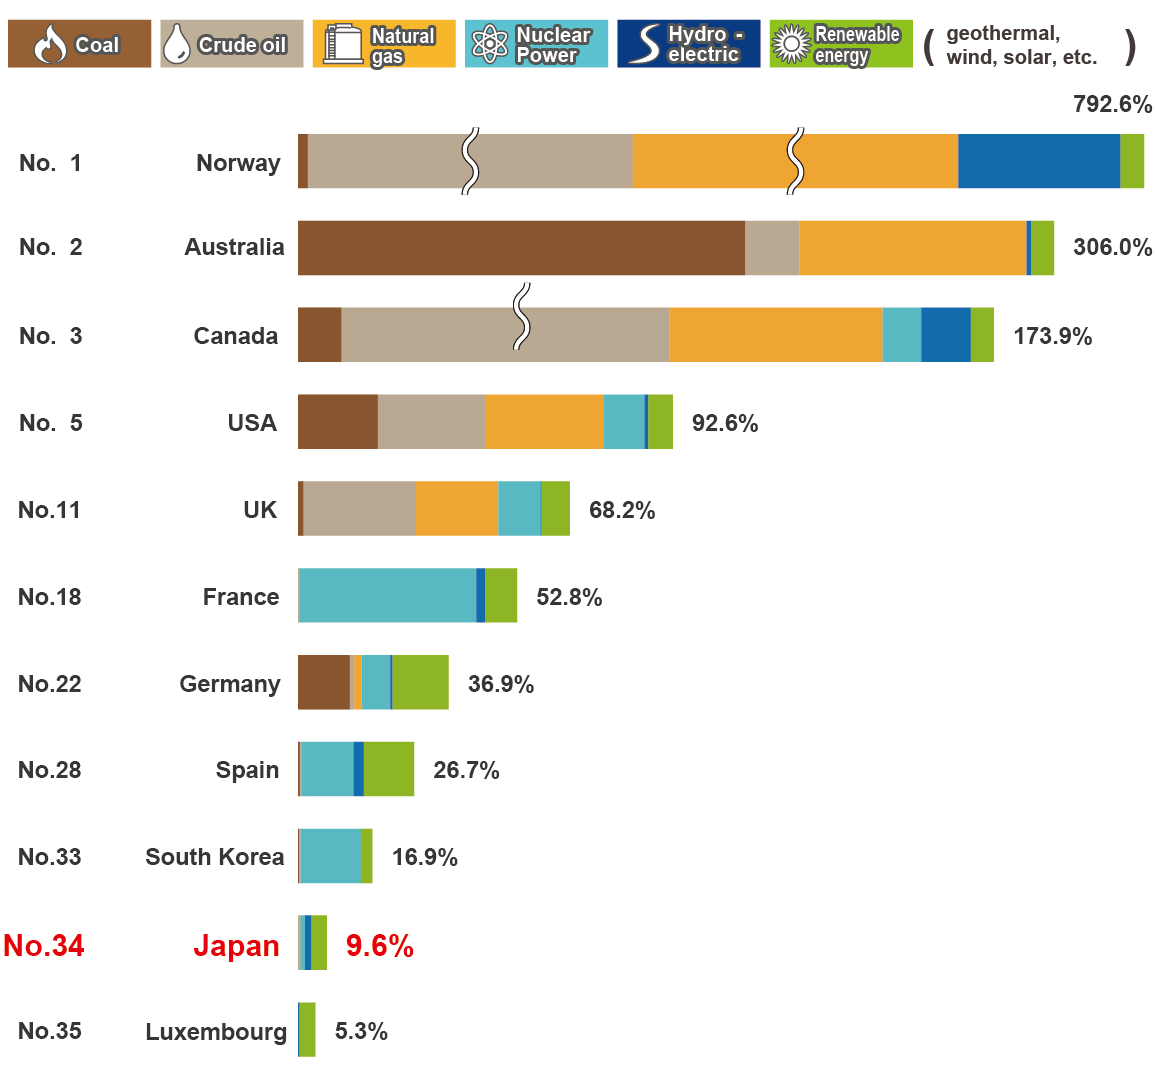
Source: 2017 estimates in IEA “World Energy Balances 2018”. For Japan only, the FY 2017 actual figures from “Comprehensive Energy Statistics of Japan”.
*The ranks in the table are those of the 35 OECD member countries in 2017.
Japan energy self-sufficiency ratio
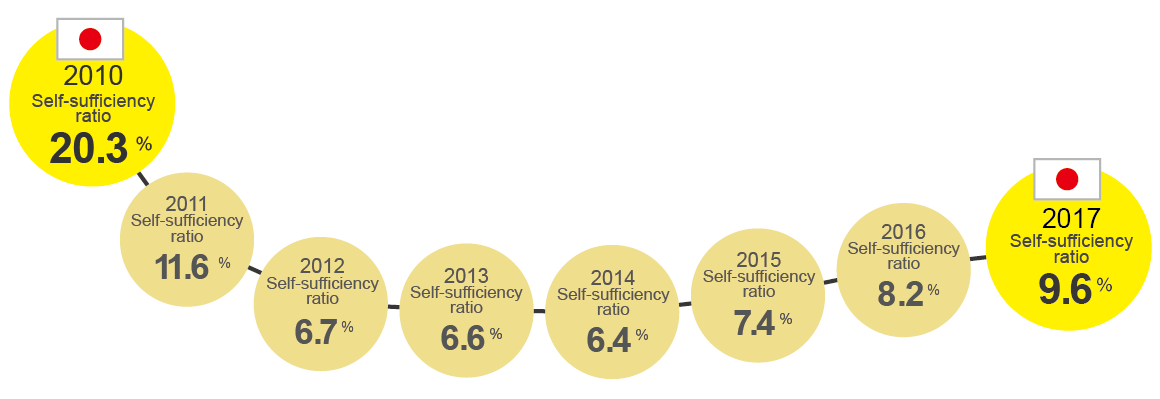
Source: FY 2017 actual figures from “Comprehensive Energy Statistics of Japan”
Japan, in particular, is largely dependent on fossil fuels such as oil, coal and LNG (liquefied natural gas). In the year preceding the Great East Japan Earthquake, Japan was dependent on fossil fuels for 81.2% of the total primary energy supply. Dependence rose to 87.4% in 2017 as a result of increased utilization of thermal power generation to make up for the shortage of electricity caused by the shutdown of nuclear power plants.
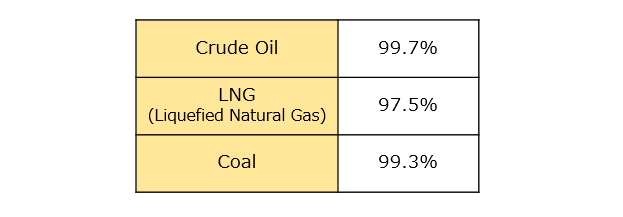
Japan depends on imports from abroad for most of its demand for fossil fuels. Ratios of dependence on imports for fossil fuels in 2018 were 99.7% for oil, 97.5% for LNG (liquefied natural gas) and 99.3% for coal.
Trends in Composition of Primary Energy Supply of Japan
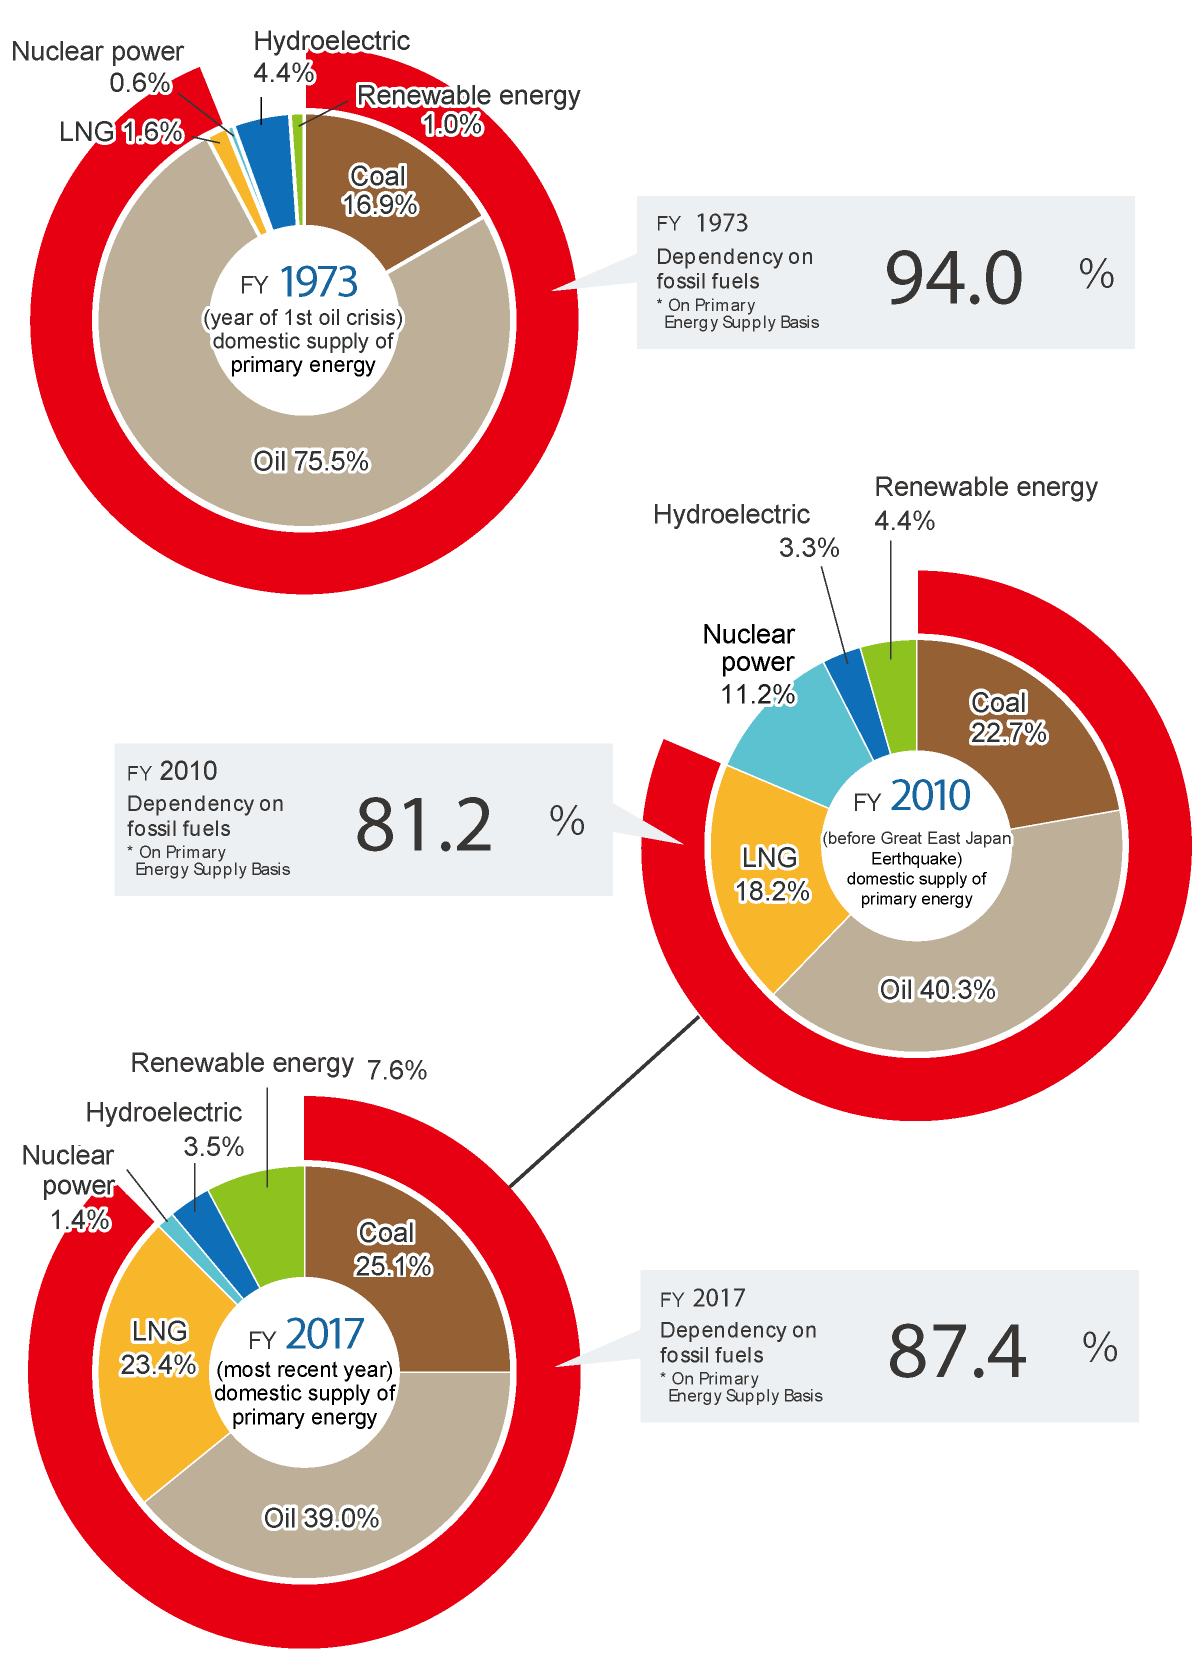
Source: Comprehensive Energy Statistics
*Figures in percentage may not add up to 100% due to rounding.
*Renewables exclude hydro and include unutilized energy
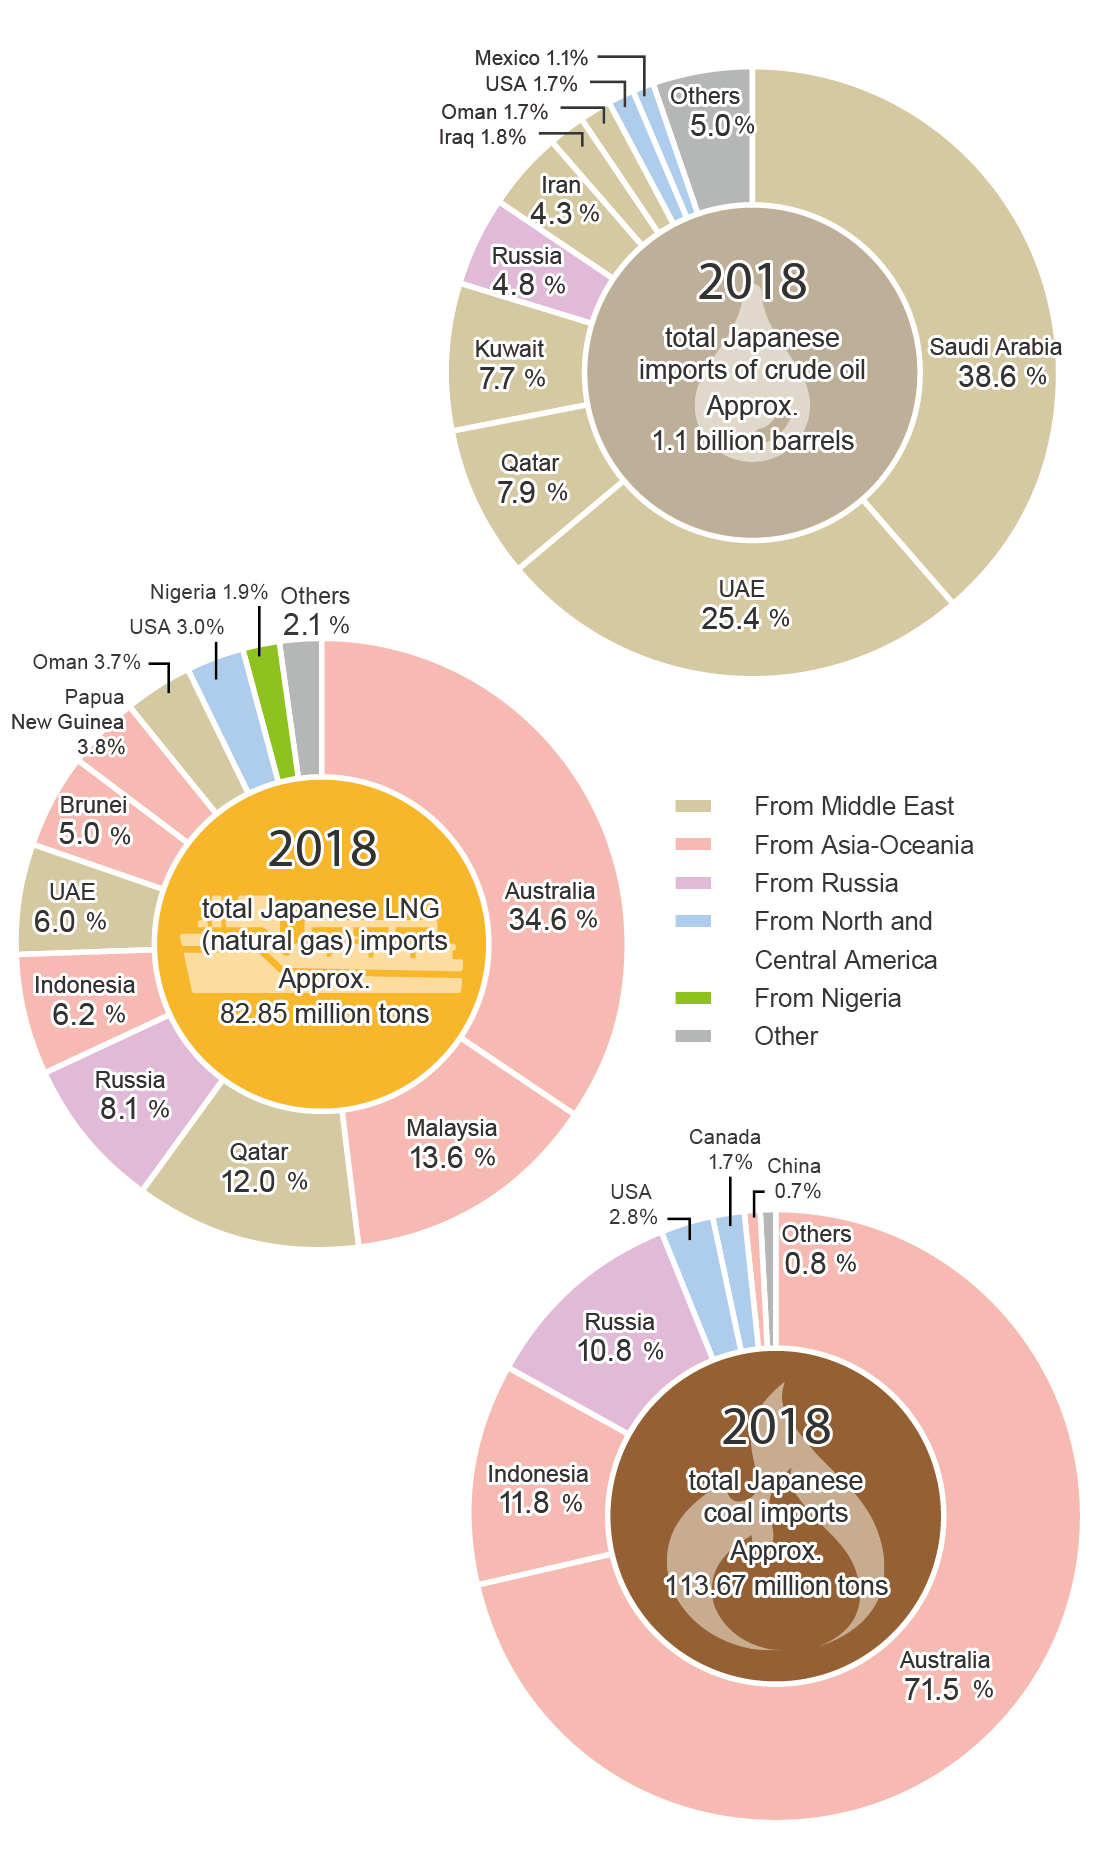
Japan’s dependency on imports from overseas for fossil fuels
Another issue is from where Japan imports resources. About 88% of crude oil is imported from the Middle East where political instability persists. Recently, a ship loaded with cargo for Japan traveling through the Strait of Hormuz was attacked. As the Middle East is one of the world’s most important suppliers of energy, securing navigational safety in the region is critical to the Japanese and international energy markets.
Regarding coal, dependence on Australia is high. On the other hand, LNG (liquefied natural gas) is being procured from well-diversified areas such as Australia, Asia, Russia and the Middle East.
Changes in electricity rates
Electricity rates increased multiple times since the Great East Japan Earthquake. This was attributable to increased utilization of thermal power to alleviate the effects caused by the shutdown of nuclear power plants. It was also due to fuel prices rising until 2014. Electricity rates had increased by around 16% for homes and around 21% for industries in FY2017 compared with rates before the Great East Japan Earthquake.
Changes in average electricity rates
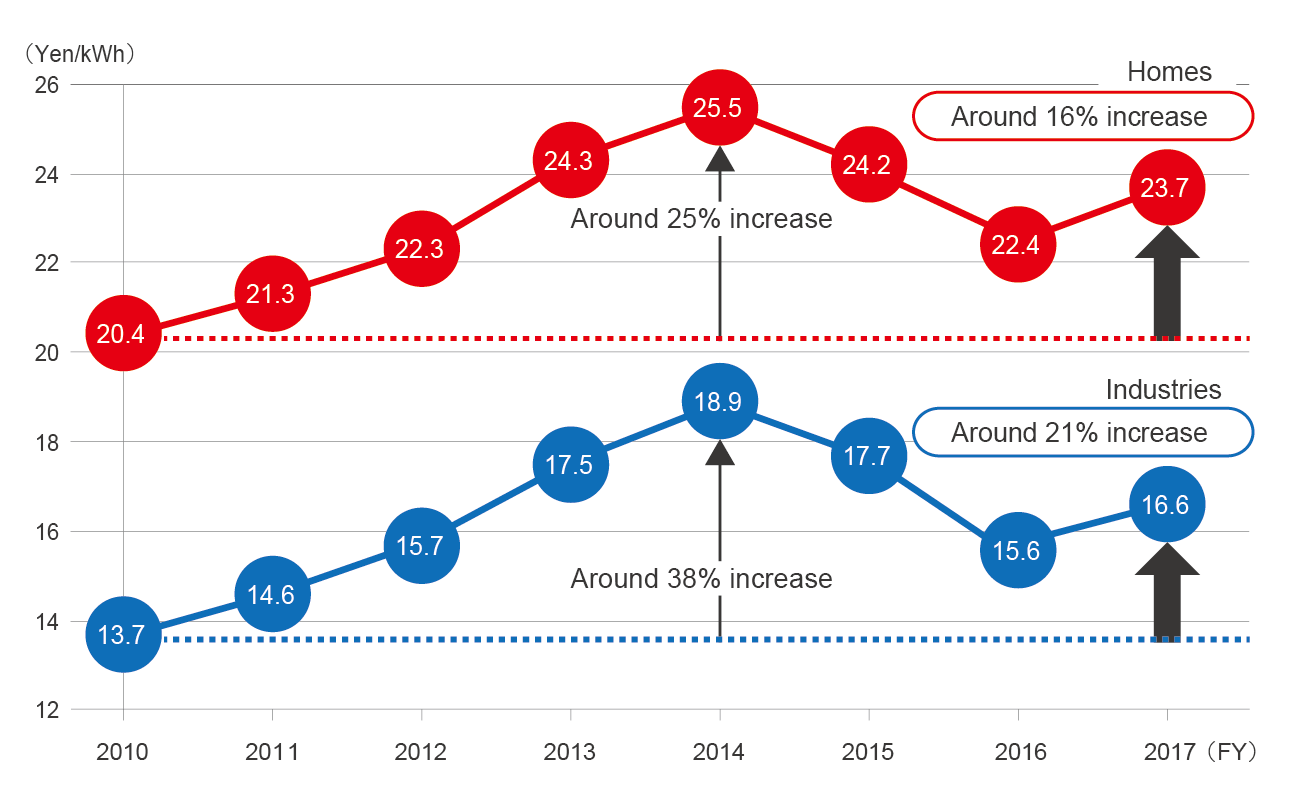
Source: Created based on monthly reports of generated and received electric power, and financial materials of each electric power company
Electricity rates are influenced largely by power sources (methods of generation). Thermal power, using fossil fuels such as oil and LNG (liquefied natural Gas) mostly imported from abroad with high energy costs, is vulnerable to changes in international energy prices. Dependence of power sources on fossil fuels was as high as 80.9% in 2017.
Changes in the Japan composition of power sources (supply)
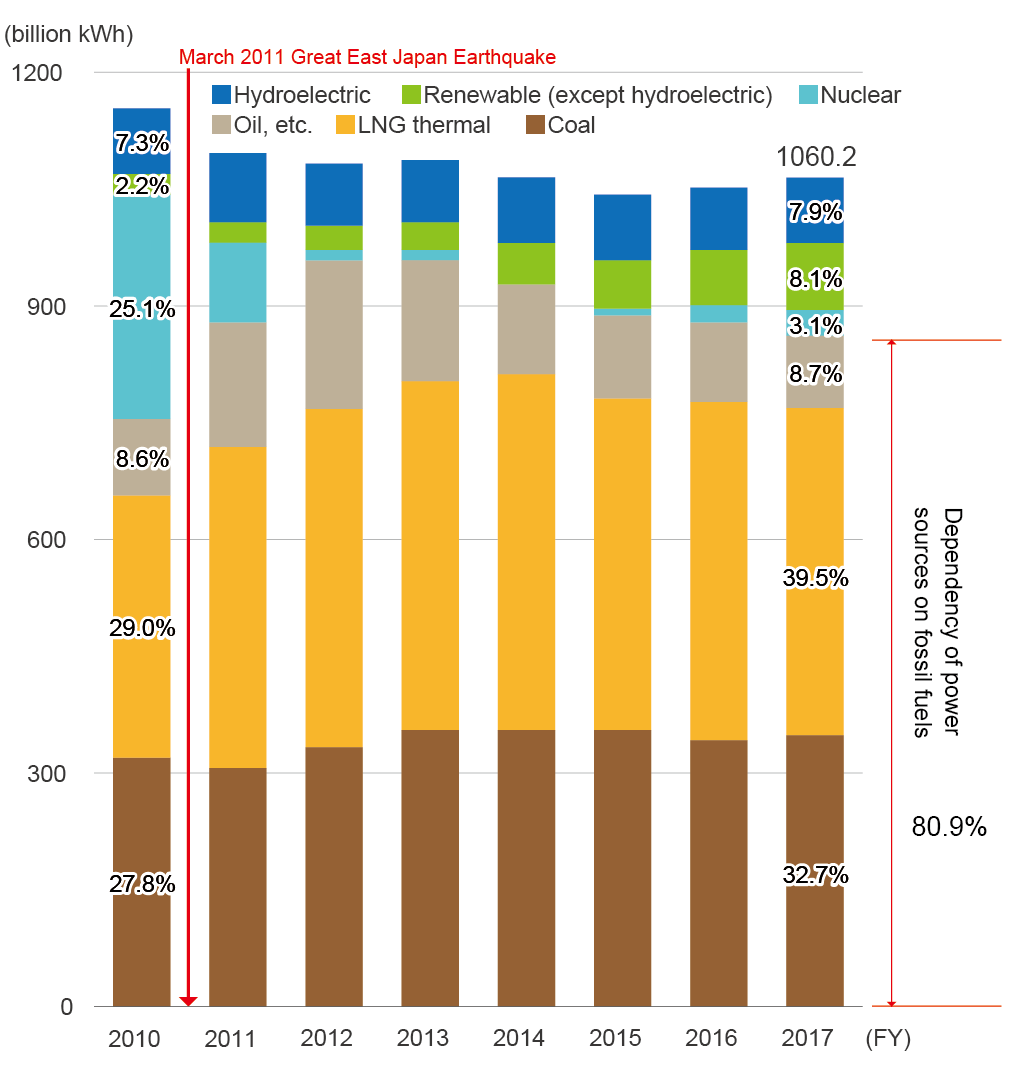
Source: Agency for Natural Resources and Energy “Comprehensive energy statistics”
Another factor impacting electricity rates in recent years is renewable energy. The feed-in tariff scheme (FIT) was introduced in 2012 whereby electricity generated by renewables was to be purchased at a fixed rate. Thanks to the FIT scheme, the installed capacity of renewable energy has increased rapidly. While it is important for renewables to expand for the future, the purchase costs have reached 3.6 trillion yen, part of which are collected by means of a “surcharge” that is paid by electricity users. The surcharge has been rising year by year, which is one of the reasons for the increase in electricity rates.
Changes in installed capacity resulting from renewable energy and other factors (Excluding large scale hydroelectric power)
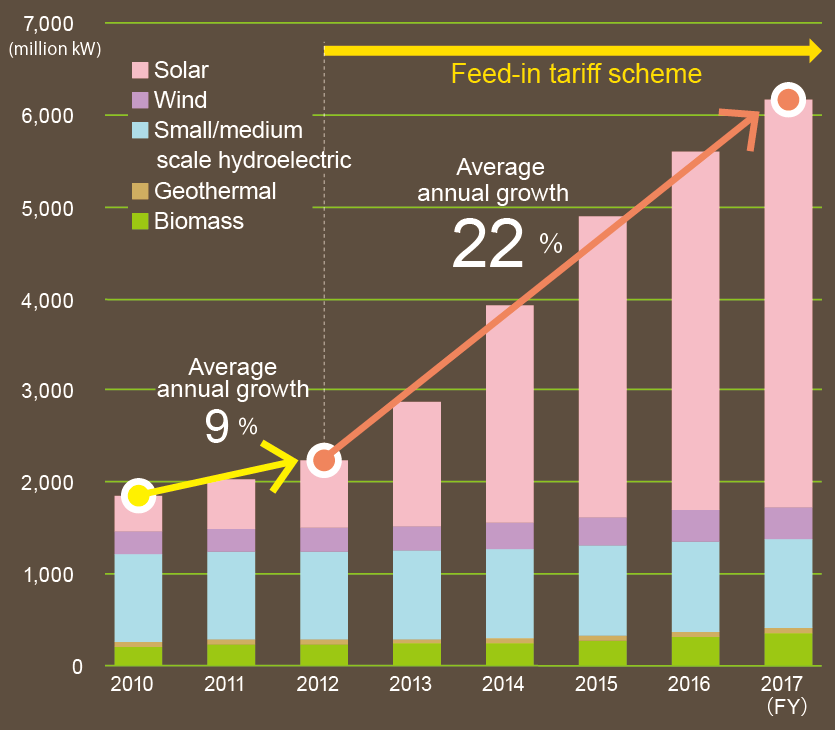
Source: Created by Agency for Natural Resources and Energy based on JPEA solar batteries shipment statistics, NEDO wind power capacity/generation statistics, survey for potential water power, current status and trends of geothermal power generation, certified results of the RPS system/FIT.
Trends in Surcharge after Introducing the FIT
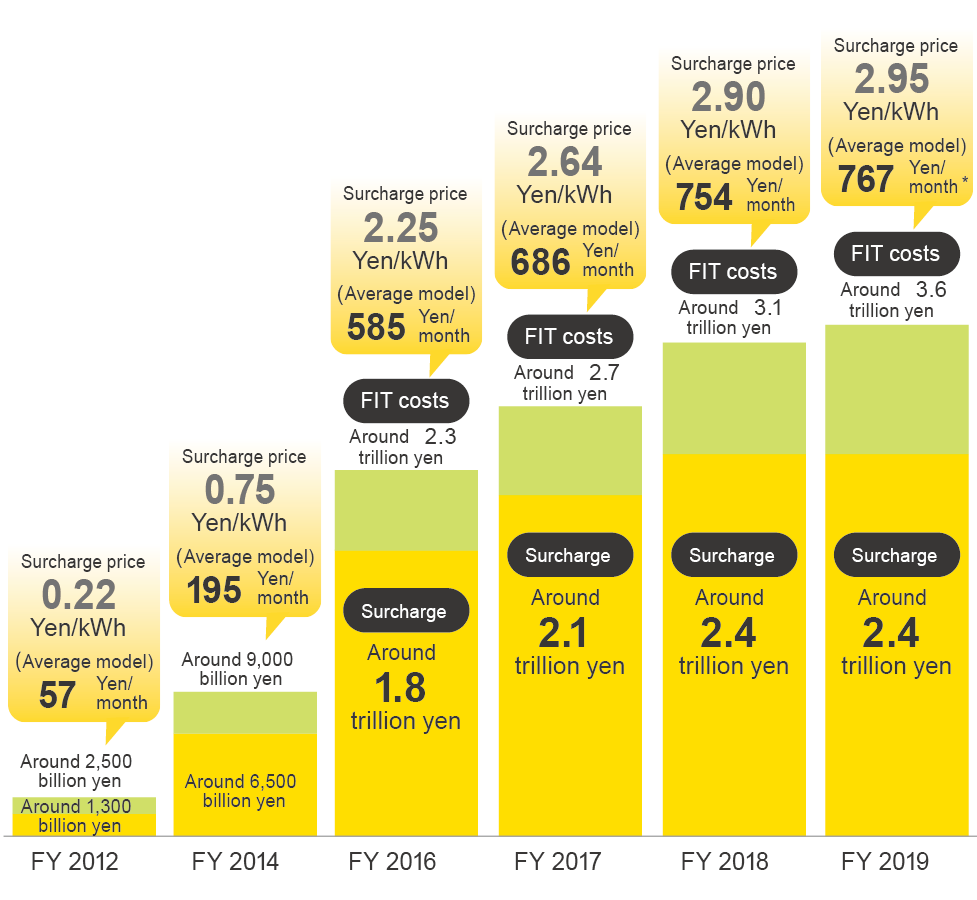
*Average model: Model with monthly electricity usage of 260kWh as posted on the websites of the Tokyo EPC and the Kansai EPC
Greenhouse gas (GHG) emissions
In order to cope with global warming, reducing greenhouse gas (GHG) emissions is an urgent issue. As fossil fuels such as oil, coal and LNG (liquefied natural gas) emit a large amount of greenhouse gases, an increase in power sources using fossil fuels would result in more greenhouse gas emissions.
Since the Great East Japan Earthquake, greenhouse gas emissions in Japan had increased until FY 2013 when the largest-ever amount of 1.4 billion tons was emitted. Then, greenhouse gas emissions took a downward turn. The amount emitted in 2017 was less than that in 2010, the year before the Earthquake.
Changes in Japanʼs greenhouse gas emissions
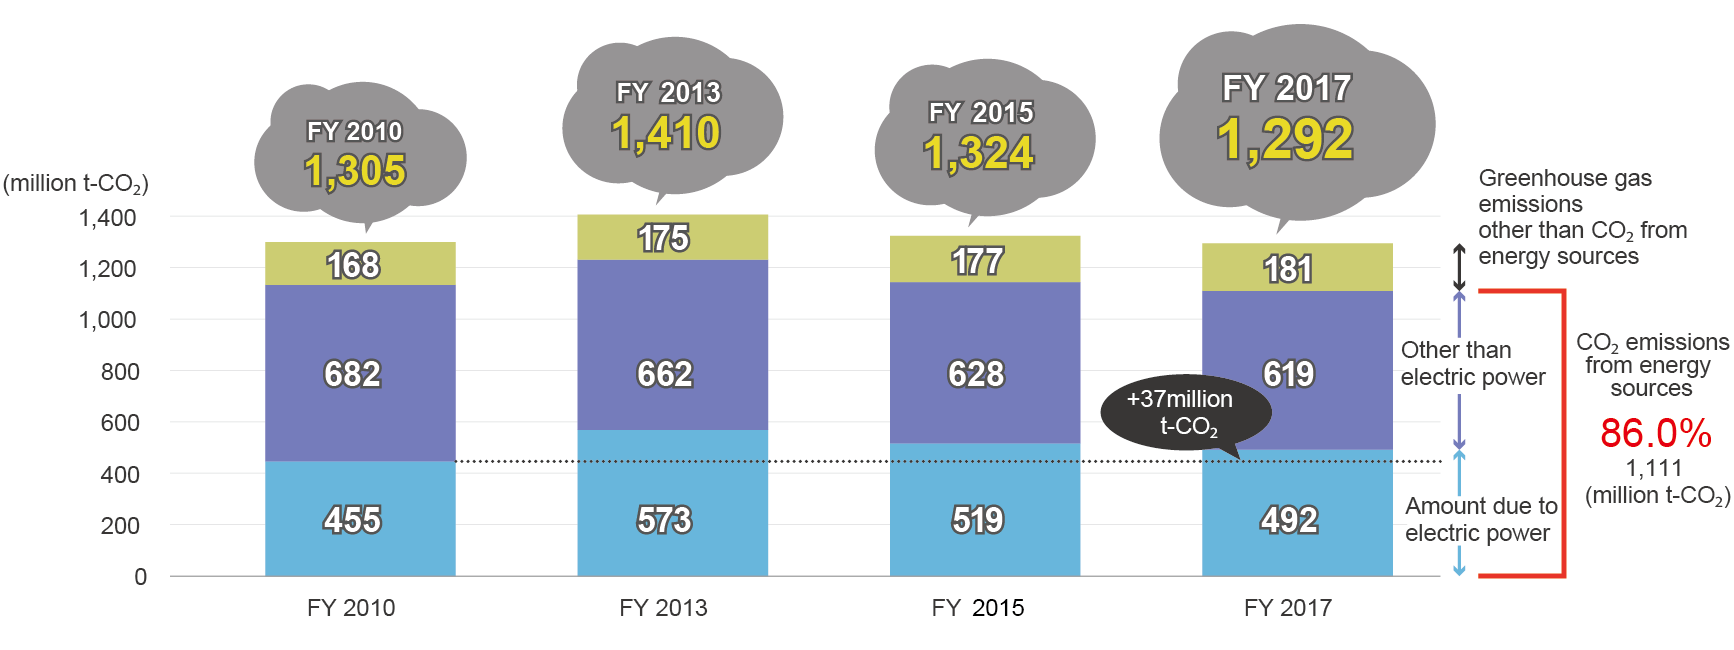
Source: Comprehensive energy statistics, environmental action plans (FEPC), and calculation results of the amount of greenhouse gas emissions in Japan (Ministry of the Environment).
However, we cannot be relieved of strenuous efforts to achieve our target pursuant to the Paris Agreement. Japan’s target is to reduce greenhouse gas emissions by 26% in 2030 in comparison to the 2013 level. It is a relatively high target amongst major countries.
Japan 2030 target: 26% reduction from FY 2013 level
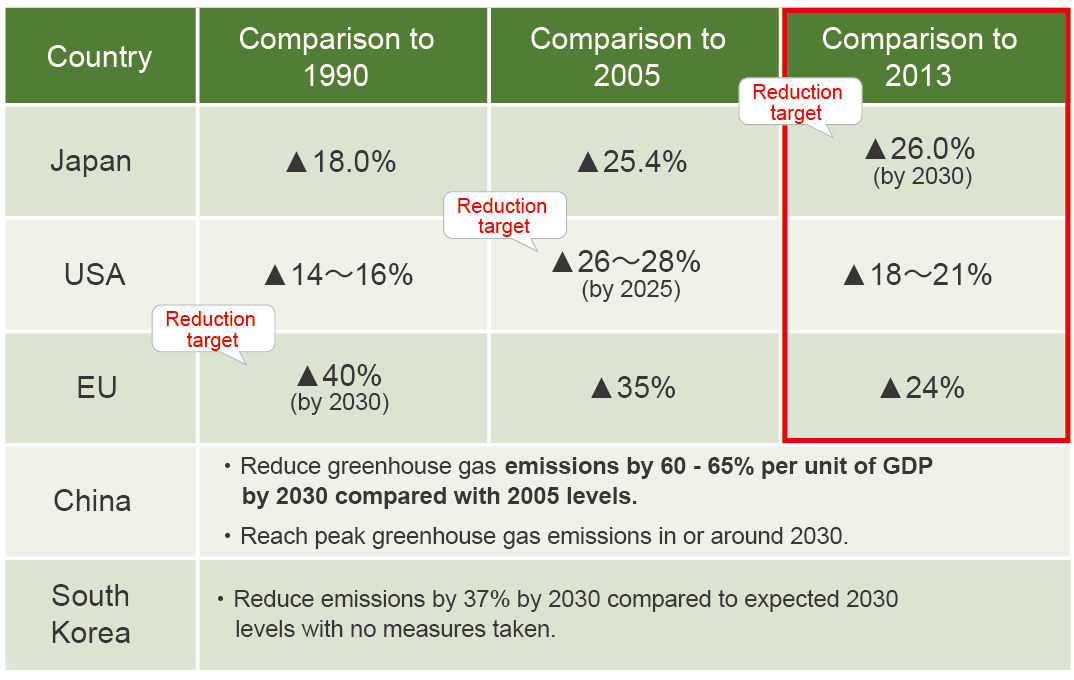
Source: Comparison of pledges from major countries (targets for reduction of greenhouse gas emissions (Ministry of Economy, Trade and Industry created)
On the other hand, global energy-oriented greenhouse gas emissions in 2016 were 32.1 billion tons of CO2. In terms of CO2 emissions from 1990 to 2016 by country, emissions in the EU are declining, they are growing in emerging nations such as China, India and Africa.
In terms of shares of greenhouse gas emissions in 2018, China held a 26.6% share which is the largest, India 6.7% the fourth, while Japan’s share was as low as 2.7%. Therefore, it is also important to make efforts to reduce CO2 emissions in emerging nations.
Changes in greenhouse gas emissions from global energy sources(1990-2016)
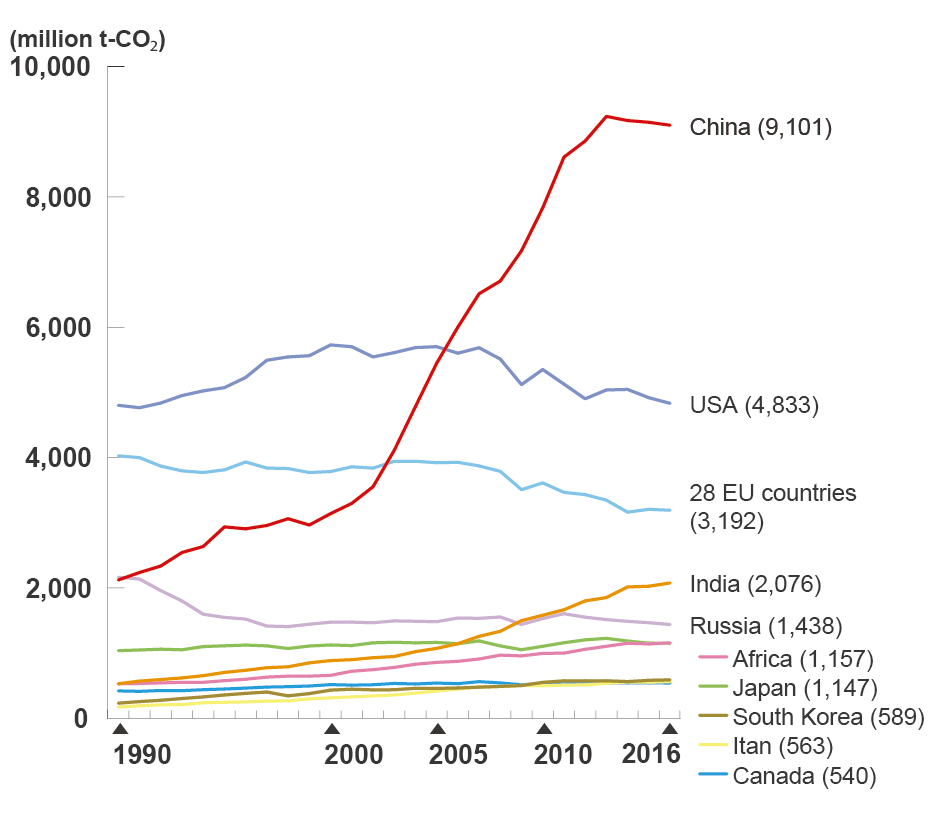
Source: CO₂ Emissions from Fuel Combustion 2018 Highlights (IEA) Top 10 countries and regions in terms of greenhouse gas emissions from energy sources, figures in parentheses are 2016 emissions (million tons)
* Greenhouse gas emissions from non-energy sources are not included.
Share of greenhouse gas emissions produced by each country (2018)
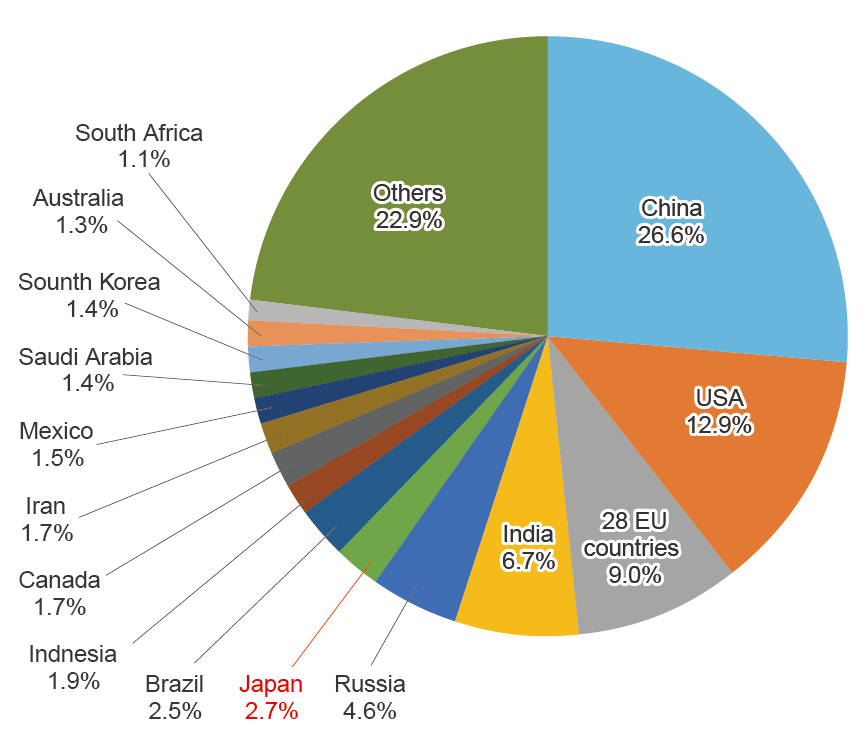
Unit: Converted to million tons CO2
Source: IEA CO2 EMISSIONS FROM FUEL COMBUSTION (2018 Edition)
2015 greenhouse gas emissions (2018 edition)
Energy policy toward 2030
The basic principle of Japan’s energy policy for the future, known as 3E+S, has been established to cope with various challenges. Keeping in mind that Safety always comes first, the principle is to simultaneously achieve Energy Security, Economic Efficiency and Environment.
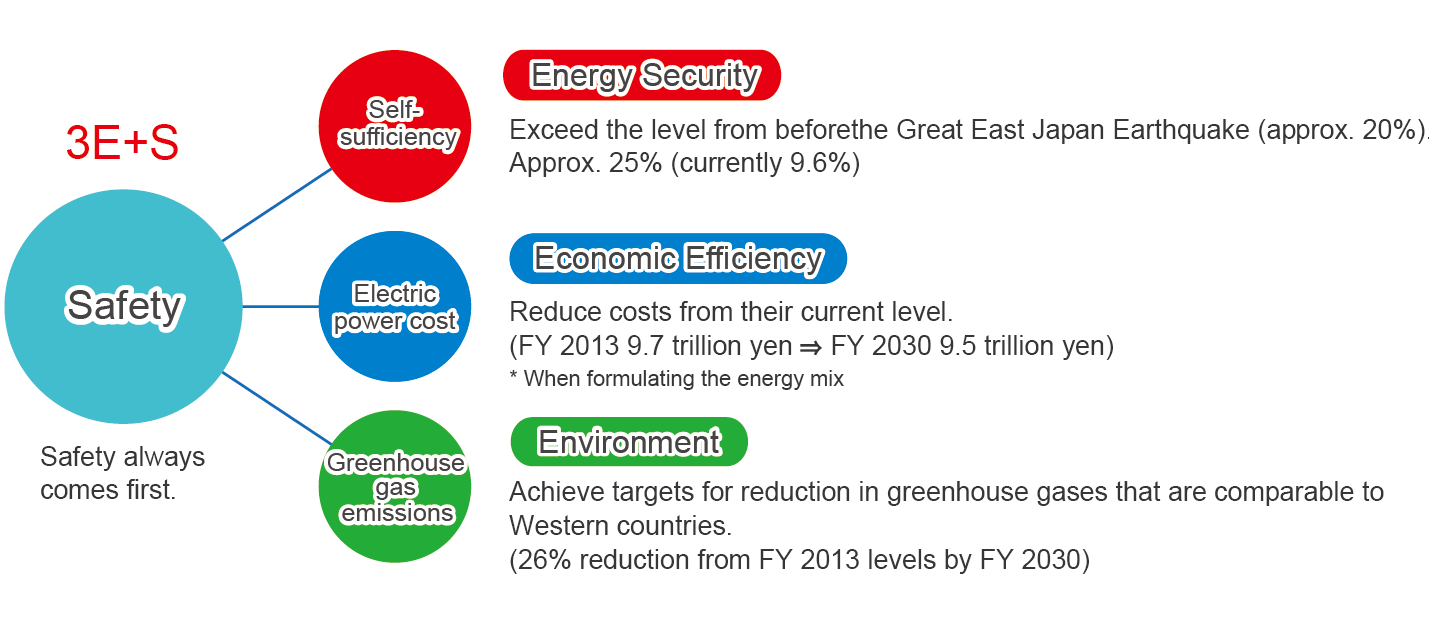
Based on the above principle, the ideal energy supply and demand structure for 2030 has been presented. It is essential to create a multi-layer energy supply structure whereby each energy source delivers maximum strength and compliments the weaknesses of the others. The structure is also called “energy mix” implying the necessity to combine various energy and power sources.
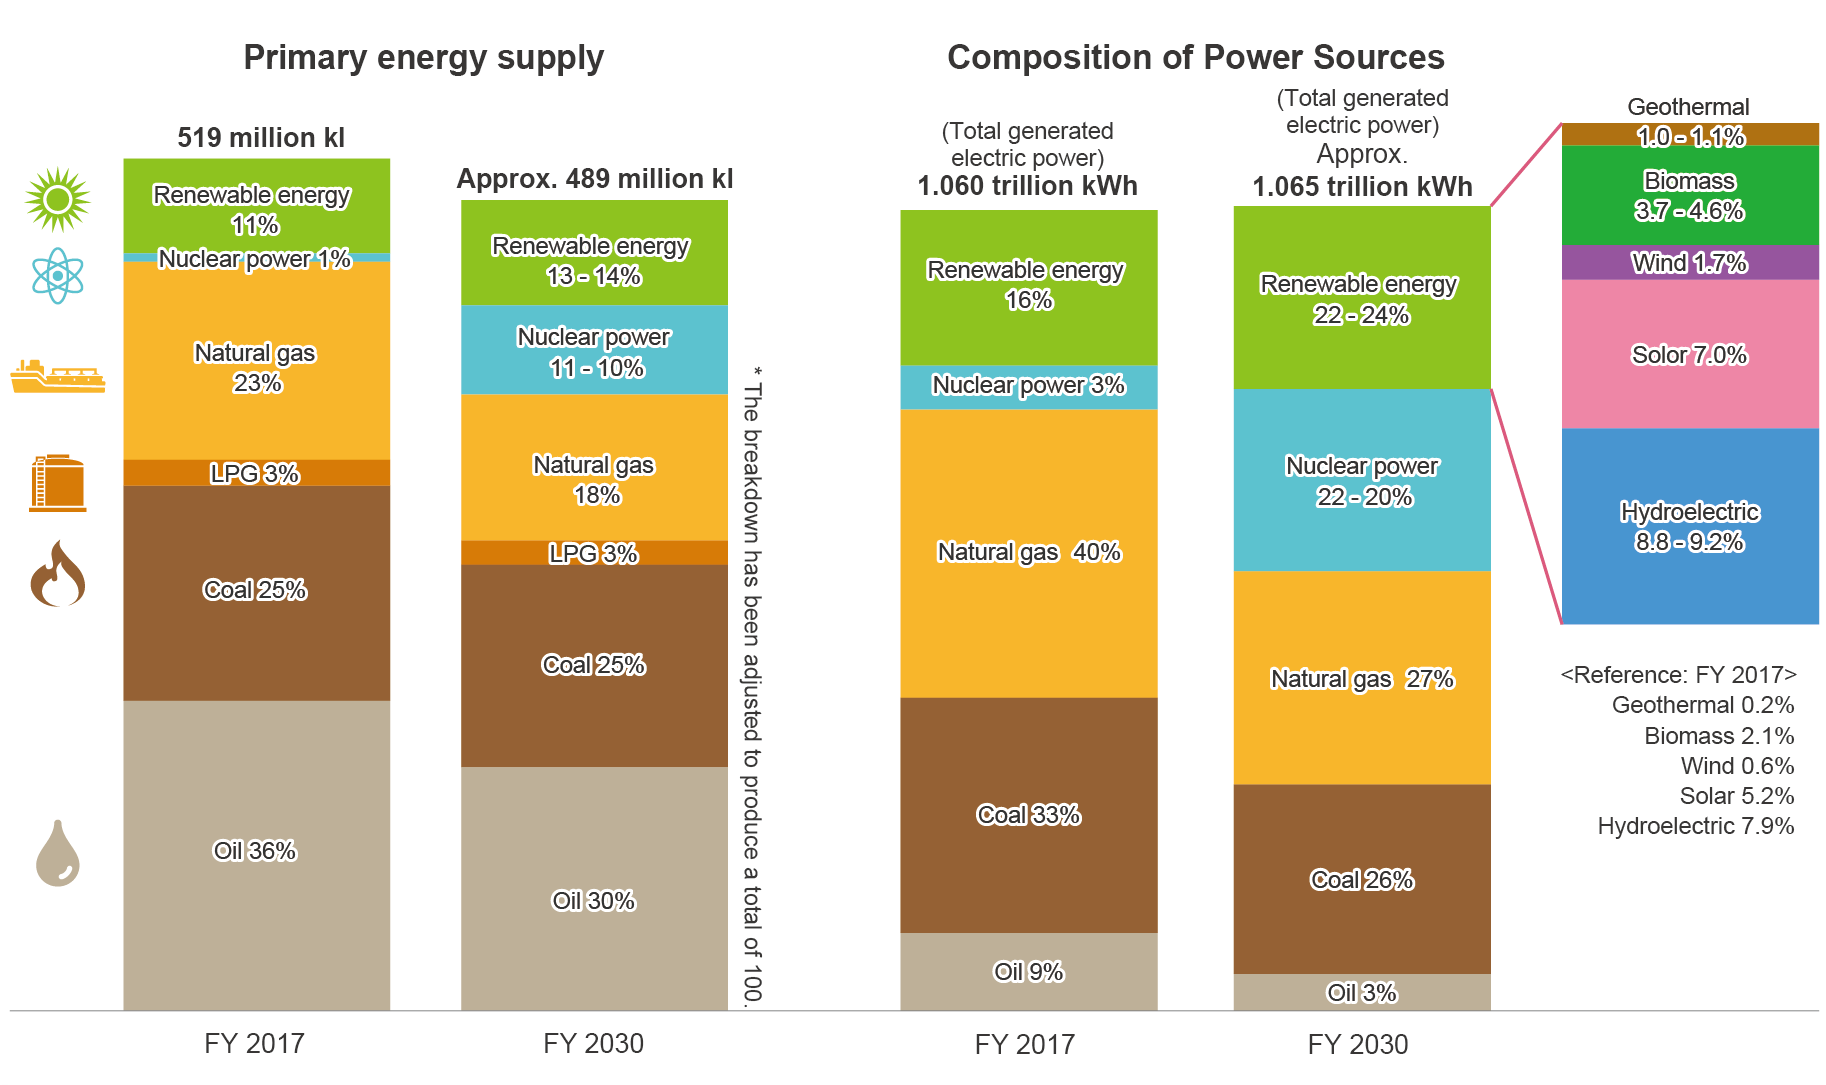
Policies to realize the ideal energy mix toward 2030 will be discussed in Part 2 of this issue.
Division in charge
Research and Public Relations Office, Policy Planning and Coordination Division
![]() The original Japanese text of this article; Click here
The original Japanese text of this article; Click here