2021 – Understanding the Current Energy Situation in Japan (Part 2)
(in provisional translation)
(English ver.) 2022-11-1
Topics of this article:
Ambitious efforts toward innovation
Japan declared its intention to achieve carbon neutrality by 2050, which will require fundamental changes to the existing systems such as technology and social structures. It is essential to encourage innovation in various fields and consider all available options. The following are some examples of ambitious efforts toward establishing innovative technologies.
1. Hydrogen and ammonia
Attention is focused on hydrogen and ammonia as next-generation forms of energy.
Hydrogen, which emits no CO2 when used, can be produced from various resources including water. If renewable energy is used in the production process, “CO2-free” hydrogen can become a reality. Fuel cell vehicles, powered by electricity produced by the chemical reaction between hydrogen and oxygen, are already in practical use. However, toward more widespread use, it is necessary to construct an adequate supply chain for larger volumes of hydrogen to meet increasing demand. To realize such a supply chain, international trading of hydrogen will have to be considered, not to mention domestic production. To this end, reform in social structures will also be required in addition to technological innovation.
Efforts toward realizing a hydrogen-based society
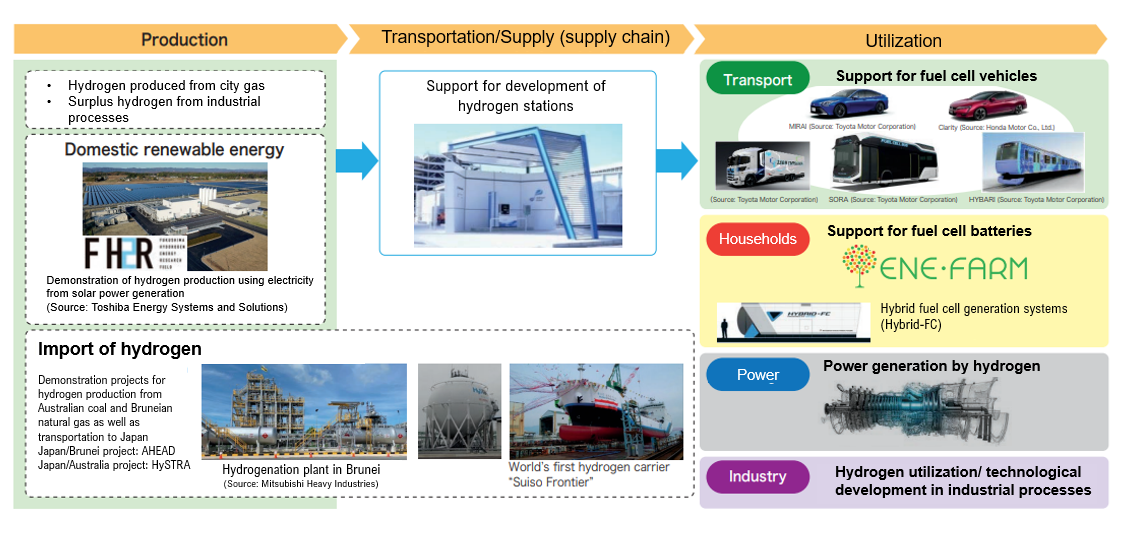
Ammonia can be used as a “hydrogen carrier,” a method to efficiently transport and store hydrogen. It is also expected to be used at coal-fired power plants. Japan is the only country that is developing technology to directly utilize ammonia as a fuel for thermal power generation facilities. It has been demonstrated that co-firing with ammonia reduces CO2 emissions. Application of this technology to the existing thermal power plants enable them to generate electricity with less CO2 emissions. Unlike hydrogen, ammonia is widely used in society, and therefore the existing infrastructure can be utilized so that it can be produced, transported, and used at cheaper costs.
2. Technological development for reducing CO2
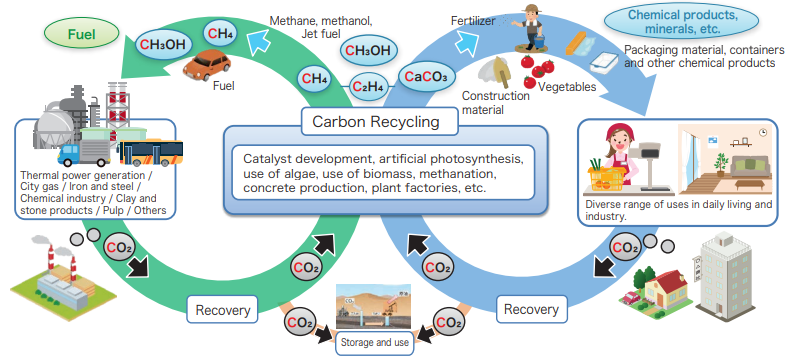
Carbon Recycling and CCUS are promising technologies for reducing CO2. These are technologies used for separating and capturing CO2 and utilizing it as a raw material resource in concrete, chemicals and fuels thereby reducing CO2 emissions into the atmosphere. Carbon Recycling is said to be the key technology to achieving a carbon neutral society, and can be applicable to every field. In order to support the development of the emerging “Carbon Recycling industry,” industry-academia-government collaboration is advancing toward the establishment of technologies and the dissemination of related products.
Carbon Recycling (reuse of CO₂)
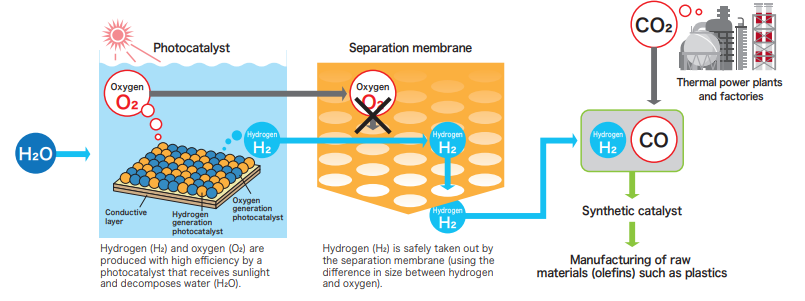
Advances are also being made in research and development for artificial photosynthesis. Like plants conducting photosynthesis with CO2, this technology attempts to produce chemical products by utilizing solar energy and CO2. Japan leads the world in the technology of artificial photosynthesis using photocatalysts, which includes production of olefin (raw material of plastics) through artificial photosynthesis.
Artificial photosynthesis
3. Practical application of innovation
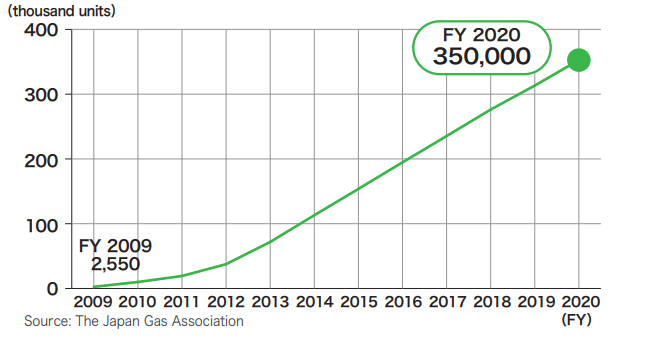
It is important to commercialize and disseminate new technologies created by innovation. One of the technologies in practical utilization is for power storage systems such as fuel cell batteries and Ene-Farm. Japan is leading the way in technological development and dissemination of power storage systems in its efforts to expand the use of fuel cells and Ene-Farm. Ene-Farm, a fuel cell that utilizes hydrogen, was commercialized for the first time in Japan in 2009 with more than 400,000 units installed as of June 2021. Efforts will be made to develop an environment in which the potential of fuel cells can be maximized with further cost reduction being pursued.
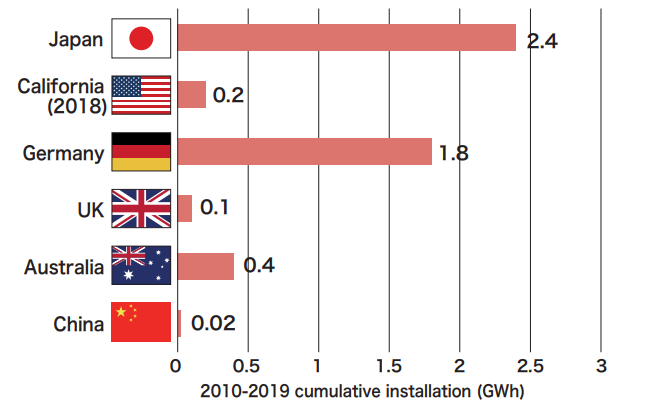
Installation record of home power storage systems in major markets
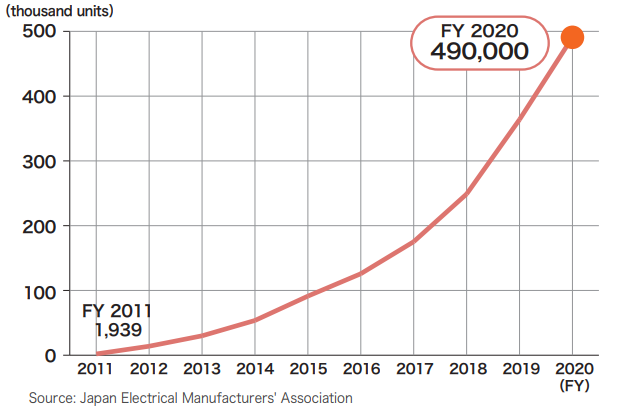
Stationary lithium-ion power storage systems in Japan (cumulative)
Number of Ene-Farms in Japan (cumulative)
Other technologies are being developed to reduce CO2 emissions. Some examples are listed below: -Flexible, lightweight, high-efficiency next-generation photovoltaic cells -DAC (Direct Air Capture of CO2) to capture CO2 from the atmosphere directly -Bio jet fuel produced from biomass materials -Methanation to synthesize methane for decarbonizing gas Practical use of various technologies in many fields will advance further reduction of CO2 emissions.
Expanding the use of renewable energy
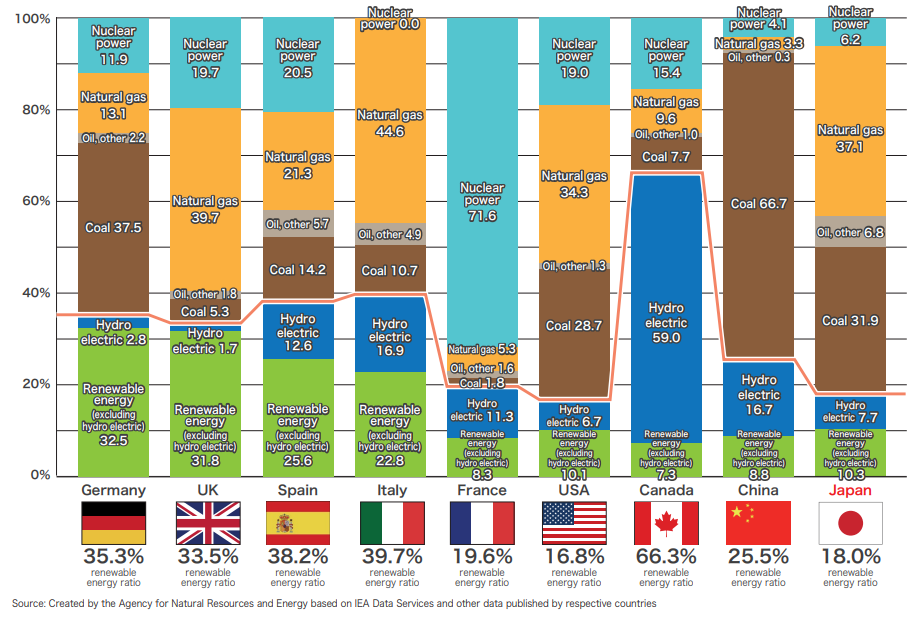
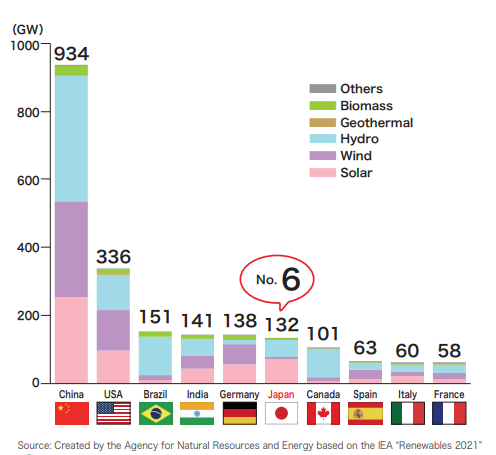
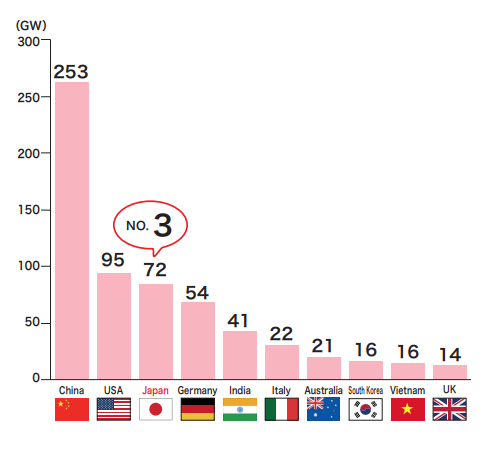
Renewable energy is indispensable to carbon neutrality and is being promoted globally. In Japan the use of renewable energy will help increase its particularly low energy self-sufficiency ratio. Thanks to the introduction of the FIT scheme, Japan ranks in sixth place in terms of total generation capacity by renewables, and in third place in terms of photovoltaic power generation alone (based on the actual figures in 2020). However, Japan’s percentage of electricity generated by renewables in total power generation is still low compared with those of other major nations, despite an increase from 10% in FY2011 to 20% in FY2020.
Comparison of percentages of renewable energy in total power generation in major nations (Percentage of total generated power)
Renewable energy power generation capacity
among major nations (Results for 2020)
Solar power generation capacity
among major nations (Results for 2020)
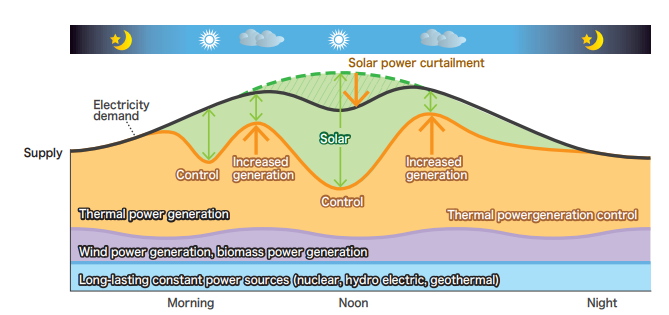
Although the use of renewable energy is expected to expand, the total energy requirement cannot be met by it alone. It is necessary to balance the supply (generation) and the consumption (demand) at all times to ensure stable access to electricity. The amount of electricity generated by renewable energy varies significantly depending upon seasonal and weather conditions. For a stable supply of electricity, renewable energy generation must be combined with thermal power generation providing variable output, or technologies such as storage batteries to compensate for output fluctuations. Excess electricity generated by renewable energy is problematic on days when there is only small demand for electricity. It is a major challenge how to balance supply and demand in expanded use of renewables.
Supply/demand situation on the lowest demand day (such as a sunny day in May)
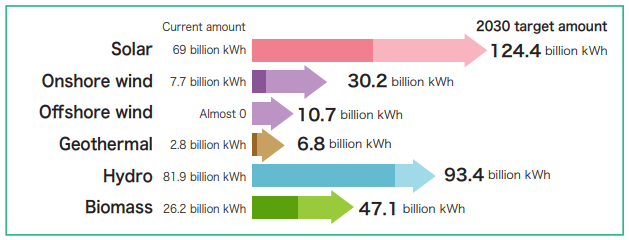
To overcome this challenge, it is important to use various types of energy sources in a balanced manner. We aim to achieve 330 to 350 billion kWh to be generated by renewable energy for FY2030. To maximize the introduction of renewable energy, wind power generation and newly built ZEHs* (zero energy houses) will also be adopted in addition to solar power. At the same time, measures will be taken to address safety concerns in case of a disaster and minimize environmental impacts.
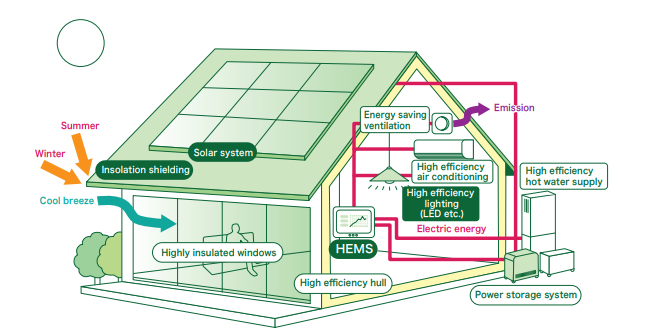
*A ZEH (zero energy house) is a house with the aim of achieving net-zero annual primary energy consumption. It uses high-performance thermal insulation and efficient equipment and systems to achieve substantial improvements in energy efficiency, which is further enhanced by the introduction of renewable energy such as solar power.
The target for the introduction of renewable energy in the energy mix for FY2030
Toward introducing greater amounts of renewable energy, it is essential to address the challenges known as “grid constraints” such as the lengthy time and high cost of connecting to the grid. One solution to this issue will be an ongoing initiative referred to as “non-firm connection,” which allows more efficient use of the power grid.
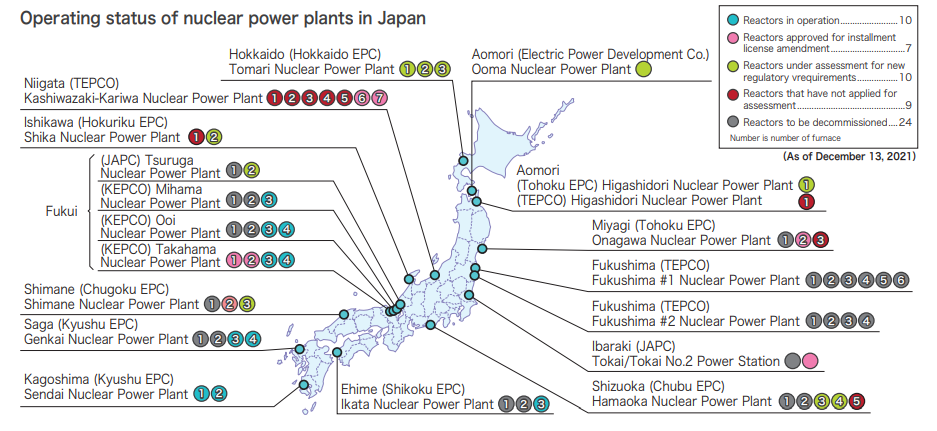
Status of nuclear power generation
Nuclear power is considered to be an essential source of electric power generation in Japan, which has limited domestic natural resources, in order to achieve a stable supply of electricity, reduce its cost, and curb greenhouse gas emissions. There are some nuclear power plants that have been out of operation since the Great East Japan Earthquake. The government policy regarding the restart of those inoperative nuclear power plants is as follows: If the Nuclear Regulation Authority recognizes that a nuclear power plant conforms with the new regulatory standards, the restart of the power plant will be advanced with the judgment of the authority respected. It must proceed on the primary premise of safety, while obtaining understanding from the local stakeholders.
Operating status of nuclear power plants in Japan
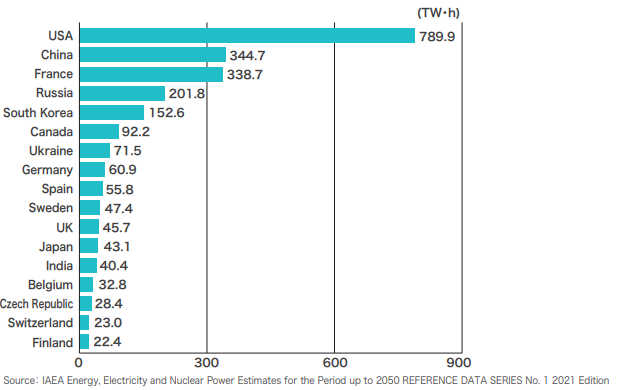
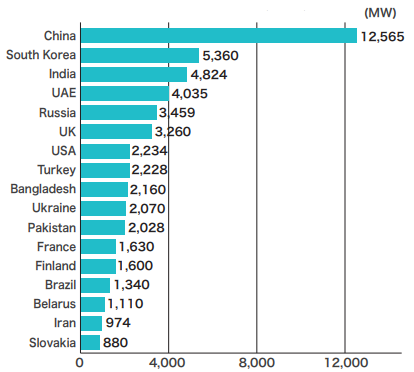
There are quite a few countries which recognize the importance of nuclear power generation. In terms of the output from nuclear power generation, the leading countries are, in order, the USA, China, France, Russia, and the ROK. Looking at the generation capacity of nuclear power plants under construction, China is leading followed by the ROK and India. In the future, the output from nuclear power plants in these countries is expected to increase.
World power output of nuclear power plants (2020)
Power generation capacity of nuclear power plants
under construction (2020)
Japan is advancing the technology referred to as a “nuclear fuel cycle,” in which spent fuel from nuclear reactors is reprocessed and the recovered uranium and plutonium are reused. The advantages of the nuclear fuel cycle are to reduce the volume of radioactive waste, to shorten the time in which the hazardousness of radioactive waste declines, and to allow effective use of resources.
The nuclear fuel cycle and geological disposal
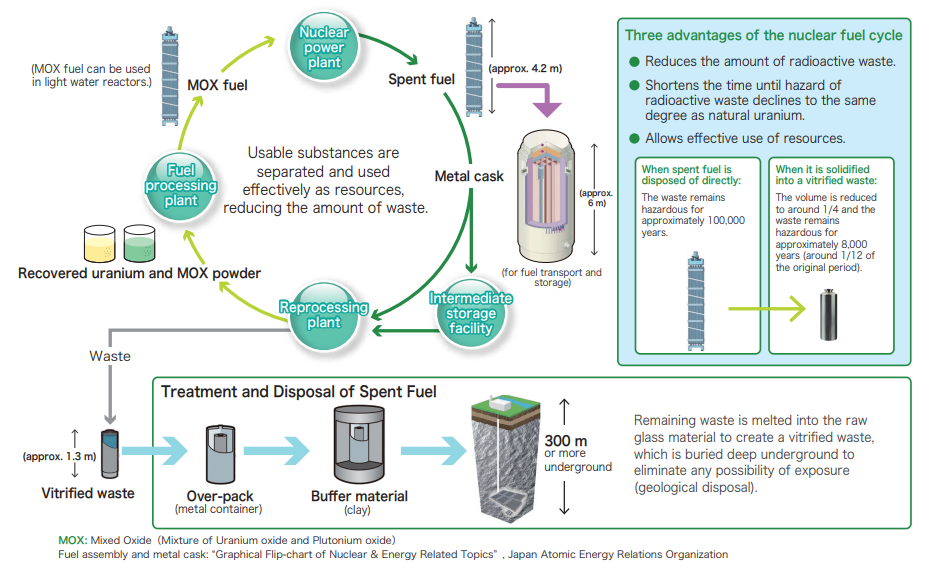
It is also necessary to discuss the final disposal of high-level radioactive waste. For this purpose, the Map of Scientific Features was published as a result of scientific research into geological formations nationwide. Efforts are also being made to promote a better understanding of the mechanism of geological disposal and the geological features of Japan. More detailed research must be conducted to determine if a site meets the conditions for final disposal. In the meantime, literature surveys will be carried out.
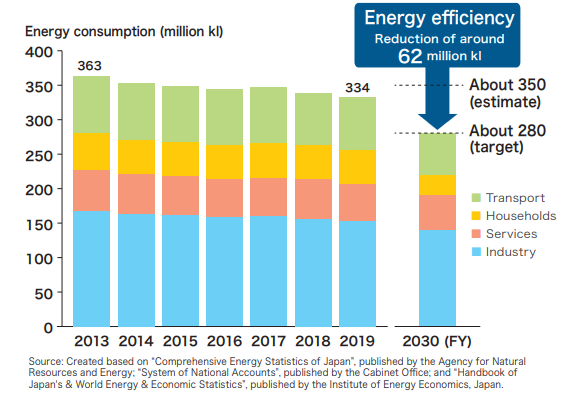
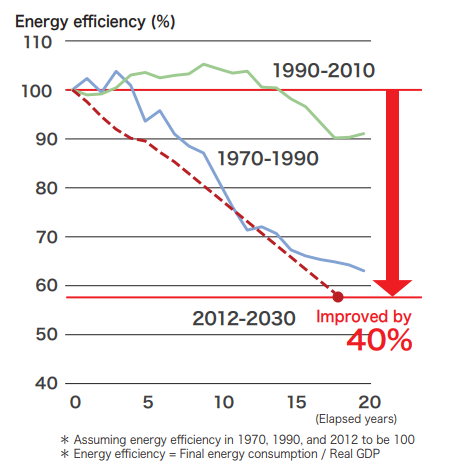
Enhancement of energy efficiency
Japan has strengthened its efforts to improve energy efficiency. To further enhance energy consumption efficiency, a target reduction amount for 2030 has been expanded to 62 million kl crude oil equivalent. Toward achieving this goal, the energy consumption efficiency must be improved by approximately 40%, an all-time high level, over the period from 2012 to 2030.
Final energy demand with the currently planned energy mix
Energy efficiency improvements
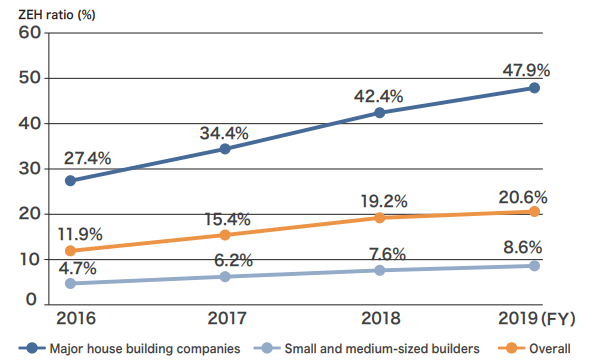
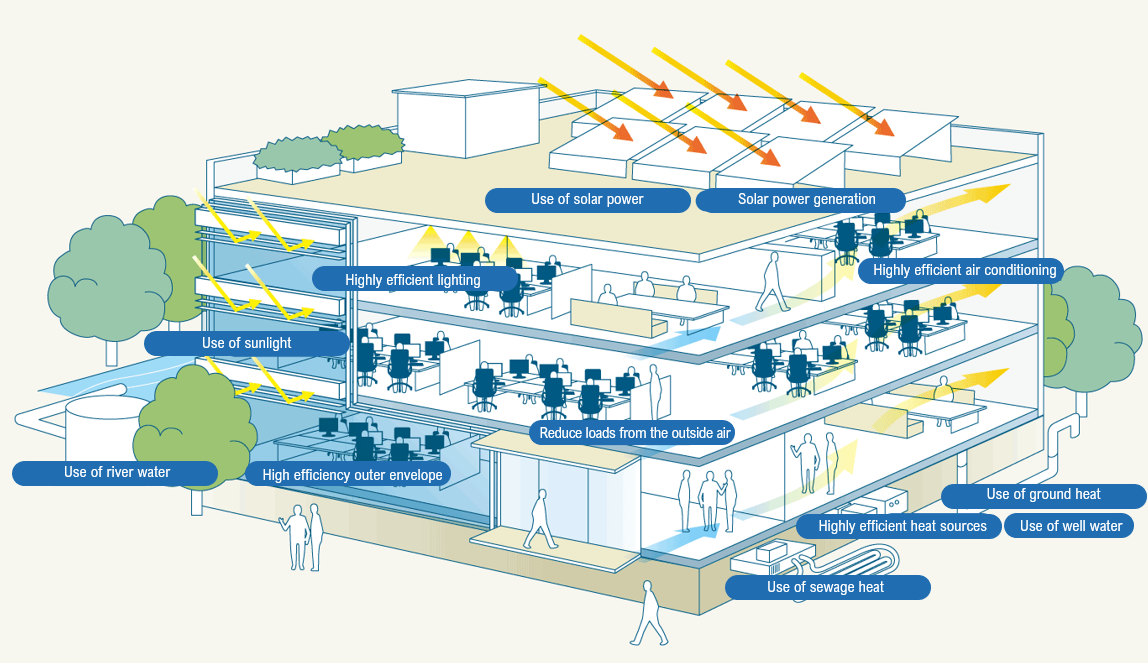
Efforts will be advanced in all areas such as industry, business, household and transport sectors to improve energy efficiency as practically as possible. In business and household sectors, the introduction of ZEHs and ZEBs* is being enhanced with the aim of applying ZEH/ZEB energy efficiency standards to houses and buildings to be built in and after FY2030.
*A ZEB (zero energy building) is a building designed with the aim of achieving net-zero annual primary energy consumption. It employs architectural design to reduce energy loads and actively utilize natural energy with highly efficient equipment and systems.
Trends in the ZEH ratio of new custom-built homes
A plan for ZEH
A plan for ZEB
It may be difficult for readers to understand the energy situation at a glance, with many challenges still unsolved. We hope that reading this article helped update your understanding of the current energy situation in Japan. Please take this as an opportunity to think about the future of Japan’s energy.
For more detailed information about the energy situation in Japan, please refer to Japan’s Energy 2021, with some of the figures updated in this article.
Division in charge
Research and Public Relations Office, Commissioner’s Secretariat, ANRE
![]() The original Japanese text of this article; Click here
The original Japanese text of this article; Click here